With 350+ metrics in Meta Ads Manager, it’s easy to feel overwhelmed as you set up and track your ad campaigns. We break down the 10 most important Facebook ads metrics so you can interpret your data like a pro and double down on creative that works.
Ever stared at your Meta Ads metrics dashboard and thought, “Is this good or bad?” Join the club.
The sheer number of metrics (over 350!) is enough to overwhelm anyone. Plus, ad benchmarks aren’t universal. What’s “good” or “bad” depends on your industry, campaign goal, Facebook ad format, target market and location.
Many marketing teams focus on the wrong metrics and waste precious time and money in the process.
To identify the metrics that matter for their businesses, smart teams use tools like Superads. Built on $2 billion in real ad spend, Superads now includes a free, live benchmarking tool that shows you exactly how your numbers stack up so you can optimize your ads and win.
But before we unpack the details, let’s take a good look at the 10 Facebook ad metrics you should track and interpret like a strategist.
Why tracking the right metrics matters

Source: Meta
When likes pour in and impressions are high, it’s easy to think your advertising campaigns are a success. But the data doesn’t always translate into business growth.
Perhaps your last Facebook ad racked up 1.2 million impressions, 15,000 likes and a cost-per-click (CPC) below $0.30. But when you reviewed your sales data, you realized you only got three conversions.
That’s the trap of vanity Facebook ad metrics. They make reports look great but don’t always reflect real wins. Instead, you should keep your eye on the performance metrics that link your advertising efforts to your business objectives.
Here’s a practical way to look at it:
- Tier 1 metrics (indicators): This tier includes vanity metrics such as likes, reach, raw impressions, “all clicks” and 3-second video views. They tell you how many people saw or touched your ad but not what they did next. These metrics can help you track brand awareness and, to an extent, measure ad effectiveness. However, they can’t help you judge the overall business impact of your Facebook ad campaigns.
- Tier 2 metrics (performance signals): This is where key Facebook ad metrics like CTR, CPC, cost-per-mille (CPM) and cost-per-action (CPA) come in. These numbers indicate whether your ad set is efficient. They can also help you optimize your Facebook ad budget and creative performance. While these metrics are more closely tied to campaign efficiency, they still don’t confirm whether your ads drove meaningful business outcomes.
- Tier 3 metrics (business deciders): This tier includes return-on-ad-spend (ROAS), conversions and customer lifetime value (CLTV). These performance metrics indicate whether your Meta ads campaigns generated actual growth and revenue for your business.
If your metrics don’t answer “Is this making us money?” or help you pinpoint what to improve, you should shift your focus to the numbers that matter.
It’s time to find out how to measure Facebook ad success and zero in on the data that leads to better creative, smarter spend and real business growth. Whether your goal is to manage your Facebook page and ads better, experiment with on-trend ad formats or scale your effective Facebook advertising campaigns, it helps to track the right metrics.
The 10 Facebook ad metrics you need to interpret like a strategist
Let’s zero in on the metrics top strategists watch obsessively:

1. CTR (click-through rate)
CTR = link clicks ÷ impressions
What CTR tells you: This performance metric tells you which percentage of people saw your ad and thought, “Yep, I’ll click that.” A high CTR is one of the first signals that your ad creative works. But clicks aren’t sales: You also need to keep an eye on other Facebook ad metrics (e.g., ad spend and conversions).
You can track your ad’s CTR in the Facebook Ads dashboard and compare campaign performance with a reporting tool like Superads.
2025 benchmarks: Good CTRs vary per industry, placement and ad format. However, the numbers typically range between 0.5% and 1.6%. Across all industries, the average CTR for Facebook ads is approximately 0.9%.
What to look for:
- High CTR, low ROAS: Your ad is of interest, but your landing page or offer doesn’t convert.
- Low CTR: Your creative could be the problem. Relook your hook and visual (will they grab your target customers’ attention?).
- A sudden drop in CTR: This usually indicates viewer fatigue. People have seen your Facebook ad too often.
Creative tips that can improve CTR:
- Lead with a bold hook. Make viewers curious, be emotive or touch on a pain point.
- Use GIFs, animations or short videos, as these formats grab attention in the feed.
- Test multiple visuals. You might be surprised by what works.
- Keep the copy tight and clear. Less is more.
- Make your call-to-action (CTA) obvious and direct. Check that it matches the landing page.
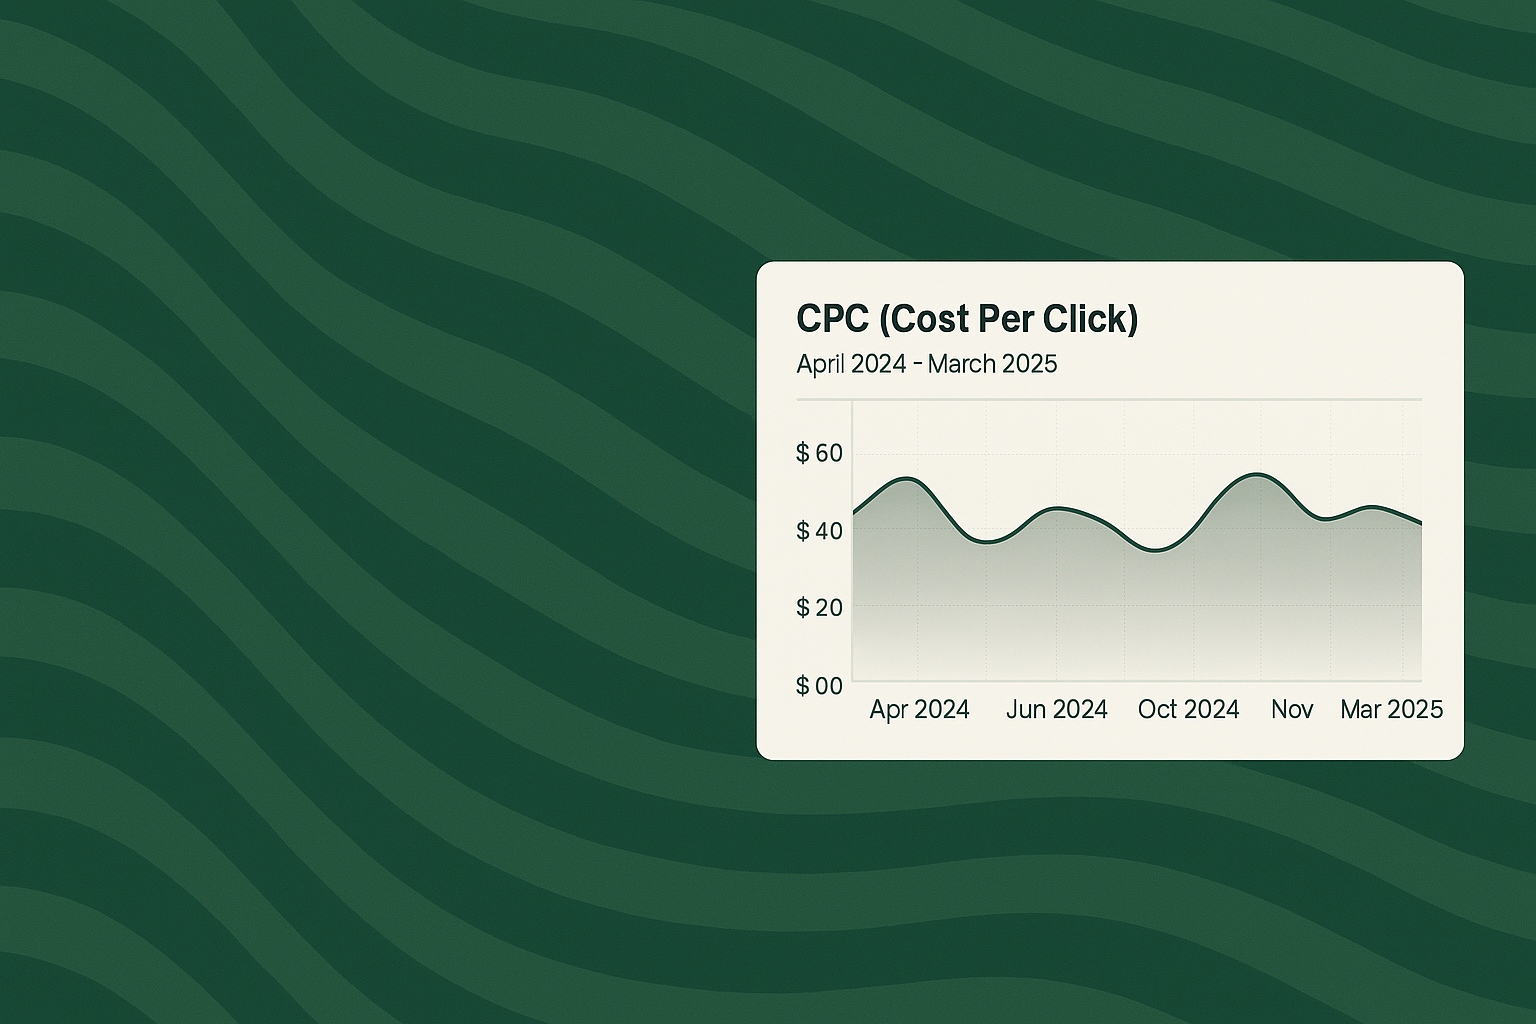
2. CPC (cost-per-click)
CPC = total spend ÷ link clicks
What CPC tells you: This metric shows how much you pay on average every time someone clicks on your ad. It’s one of the most straightforward Facebook ad metrics and essentially measures how much you pay for viewer attention. A high CPC means higher costs, so keep a close eye on this number. A high CTR with a high CPC is an indication of effective but expensive Facebook ads, while a low CPC with no conversions may appear good but ultimately doesn’t achieve business growth.
2025 benchmarks: CPC varies by industry and ad format. For example, financial advertisers face the highest CPC rates on Facebook ads, at approximately $3.77 per click. Meanwhile, sectors such as apparel, retail and travel typically enjoy lower CPCs (from $0.45 to $0.70). The overall average CPC on Facebook is $1.72, according to recent Meta Ads data.
Hot tip: Try the Superads CPC Benchmark tool for detailed comparisons.
What to look for:
- CPC on the rise: More competition or ineffective creative could be at play.
- CPC under $1 but no conversions: People click but don’t act. Check your landing page or offer. Is it strong enough?
- High CPC on lead-gen: Your targeting or creative is likely off.
Creative tips to lower CPC:
- Refine your audience for better relevance and lower ad cost.
- Use bold visuals. Think contrast, faces, bright colors and strong composition.
- Keep the copy clear and set expectations before the click.
- Avoid clickbait. This tactic usually attracts clicks but hardly any conversions.
- Test new ad formats like carousels, short videos or Stories to refresh your ads.
3. CPM (cost-per-mille)
CPM = (total spend ÷ impressions) × 1,000
What CPM tells you: This performance metric shows how much you pay to show your ad 1,000 times. It’s a foundational Facebook ad metric that tells you how competitive your ad is in the auction and how much it costs to reach your audience.
A low CPM means it doesn’t cost you much to reach people. But if your target customers don’t engage with your ad, it’s ineffective. While a high CPM with good engagement indicates that your ad is effective, it also incurs higher costs.
2025 benchmarks: CPM benchmarks typically range from $5 to $18 across most industries (note, however, that this could vary by region and campaign objective).
CPM ad costs depend on factors like competition, target audience, ad quality, campaign goals, timing (like holidays) and where your ad appears (Facebook, Instagram or Audience Network).
What to look for:
- High CPM + low CTR: Your budget is wasted on ineffective creative assets. Revise your visuals or copy.
- Rising CPM: Auction competition or seasonality could be at play. Adjust your bidding or targeting.
- Low CPM but low engagement: Inefficient audience targeting or ad fatigue could be at play.
- High CPMs paired with strong CTR and ROAS: This usually indicates that your ad creative hits the mark.
Creative tips to improve CPM:
- Match creative format to placement (e.g., vertical videos for Stories and Reels; square images for the feed).
- Use strong visuals and clear branding upfront.
- Sharpen your audience targeting. More relevance lowers CPM.
- Test bidding strategies, such as cost cap or target cost, to determine the most effective approach.
- Refresh your creatives to avoid viewer fatigue.
4. ROAS (return on ad spend)
ROAS = revenue generated from ads ÷ ad spend
What ROAS tells you: When your goal is revenue, ROAS is the metric you should watch like a hawk. It shows how much money you earn for every dollar spent on your ads. For example, a ROAS of “3” means you make $3 for every $1 spent.
A high ROAS signals profitable ads, while a low ROAS may indicate a disconnect between your ad creative, audience or offer.
This metric helps you to:
- Measure which advertising campaigns make money versus those that waste budget.
- Optimize and reallocate funds to top performers.
- Make smart budget decisions based on actual returns, not just vanity metrics.
2025 benchmarks: Across all industries, the median ROAS on Facebook is “2.2,” while a “good” ROAS is typically “3” or higher. Brands with low profit margins often need to hit this threshold to stay profitable.
However, businesses with high CLTV, such as companies that offer subscription software, may be satisfied with lower upfront Return on Ad Spend (ROAS). These companies know they’ll recover costs over time.
What to look for:
- High ROAS: Your ads are effective. Increase your budget if you can.
- Low ROAS: Check your audience and creative. Something is off.
- Good ROAS but poor lead quality: ROAS alone doesn’t tell the full story.
Creative tips to improve ROAS:
- Align your target audience with your business goals.
- Test several CTAs to drive higher conversions.
Superads bonus: Did you know Superads can break down your ROAS by creative elements like CTA and visual style? This functionality helps you spot which parts of your ads truly drive revenue.
5. Frequency
Frequency = total impressions ÷ unique reach
What frequency tells you: This metric tracks the average number of times a person sees your ad. Example: 1,000 people who see your ad 2,000 times equals a frequency of 2.
An ad that’s seen multiple times can reinforce your message, build brand awareness, increase your CTR and boost conversions. However, overexposure can lead to ad fatigue, which may drive down your CTR and increase your CPC. This makes frequency an important Facebook ad metric to monitor.
2025 benchmarks: There’s no one-size-fits-all frequency for Facebook ads, but brand advertisers often start with a cap of 1–2 impressions per user per week. This helps balance reach and engagement with ad fatigue. The ideal frequency depends on factors like market size, message and media type.
What to look for:
- Rising frequency + falling CTR: Viewer fatigue is at play. Refresh your creatives or retarget your ads.
- Rising frequency + steady/rising CTR: Reinforcement is paying dividends. Consider scaling your ads.
- Low frequency + low CTR: Not enough exposure. Boost your budget or greater reach.
Creative tips to improve frequency:
- Rotate your creatives regularly.
- Refresh your visuals and copy throughout the campaign.
- Expand or adjust your audience size.
- Use frequency caps in Facebook Ads Manager.
6. Thumbstop ratio (video ads only)
Thumbstop ratio = (3-second video views ÷ impressions) × 100
What the thumbstop ratio tells you: This metric shows how well your video creative captures attention in the crucial first seconds. It measures the percentage of viewers who watch at least three seconds after your video appears in their feed. Put simply, the thumbstop ratio tells you if your video opens strong enough to quickly earn viewers’ attention.
A high thumbstop ratio means your video engages viewers visually and emotionally from the first frame, which helps improve watch time, CPM and ad delivery efficiency.
For example, a thumbstop ratio of 30% means 30% of viewers stuck around for at least 3 seconds.
This metric can help you:
- Measure how well your video hooks viewers immediately.
- Identify which thumbnails, headlines and opening visuals grab attention.
- Adjust your ad creative to enhance early engagement and other key campaign metrics that occur later (e.g., purchases or sign-ups).
2025 benchmarks: On Facebook, a strong thumbstop ratio falls between 30% and 42%. Note, however, that it varies across industries (and it's planned to be added to our Facebook Ads Benchmark tool as a metric some time soon).
This metric isn't available natively in Meta Ads Manager. It needs to be added as a custom, calculated metric. You can also find it in Superads directly, with no effort on your end. Furthermore, on Superads you can find a Hook Score which uses the thumbstop ratio to benchmark each ad against each other in your ad account.
What to look for:
- High thumbstop ratio: Your video hooks viewers. It’s time to scale.
- Low thumbstop ratio: Try new hooks, visuals or thumbnail headlines to grab attention sooner.
Creative tips to improve your thumbstop ratio:
- Overlay clear, benefit-driven headlines on video thumbnails.
- Start with motion or unexpected visuals to disrupt patterns.
- Use color contrast, bold typography or product close-ups in the opening frames.
- Avoid slow fades or long intros. Get to the point quickly.
- Test multiple thumbnails per video to engage different audience segments.
7. Conversions
Conversions = valuable user actions defined by your campaign goals
What conversions tell you: This metric tells how well your ads drive real results. Not all conversions are equal, and a drop might indicate issues after the click rather than in the ad.
Before you analyze your conversions, make sure you’ve clearly defined what counts as a conversion for your specific Facebook campaign. This could include:
- Add to cart
- Purchase
- Lead form submission
- App install
Conversions are tracked via Meta Pixel, Facebook SDK or Conversions API, and uses:
- Standard events (purchase or lead)
- Custom events (specific actions)
- Custom conversions (based on URLs or events)
Key metrics to track include:
- Cost-per-conversion = what you pay per action
- Conversion value = total value from actions
- Conversion rate = (conversions ÷ unique clicks) × 100
2025 benchmarks: The average conversion rate for Facebook ads sits at 8.78% across all industries. While this is relatively high for a digital platform, actual performance depends on your industry and campaign objective.
What to look for:
- Conversions are up + stable or cost per conversion is down: This is good news. It’s time to scale your Facebook campaign.
- Conversions are down + cost per conversion is up: Potential issues with ads, audience or conversion funnel. Investigate further.
- Good conversion rates but poor lead or customer quality: Your ROAS and other key campaign metrics can reveal more than just conversion numbers alone.
- Conversions drop, but CTR or impressions stay steady: This could indicate a problem in the post-click experience (and not in your ads).
Creative tips to improve conversions:
- Match your creative message to your conversion goal (e.g., product value vs. trust).
- Use clear, strong CTAs tailored to your audience’s intent.
- Test different landing pages to find which designs and copy convert best.
- Make sure your landing pages are mobile-friendly and have a fast load time.
- Use dynamic product ads to show relevant products based on user behavior.
8. CPA (Cost per action)
CPA = total ad spend ÷ number of user actions driven by your ad
What CPA tells you: CPA shows how much you spend on average for each action your ad drives (e.g., clicks, purchases or signups). This metric helps measure how efficiently your budget turns into meaningful results.
For example, a CPA of $15 means you spend $15 for each action taken. A low CPA is beneficial if those actions result in value. A high CPA might indicate poor targeting or ad quality, but context is also important.
Your CPA helps you:
- Measure how efficiently your ads drive key actions across your Facebook advertising campaigns.
- Compare creative and audience performance with custom metrics.
- Set spend limits based on what’s profitable for your business.
- Get a complete picture of how your campaigns run across different audiences and ad sets.
2025 benchmarks: Across all industries on Facebook, the average CPA is $18.68, but costs vary widely by sector. The education sector typically sees lower CPAs at around $7.85, thanks in part to Facebook and Instagram’s younger audience. In contrast, sectors such as automotive ($43.84), home improvement ($44.66) and technology services ($55.21) face significantly higher acquisition costs. However, these can still be sustainable, given their higher CLTV.
What to look for:
- High CPA + low conversions: Check your target audience and creatives. Do they align with the funnel stage?
- Low CPA + poor lead or customer quality: CPA alone doesn’t guarantee value. Focus on actions that will help drive revenue.
- Stable CPA, but customer acquisition cost (CAC) is on the rise: Reassess attribution and funnel performance.
Creative tips to improve CPA:
- Use clear, benefit-driven messages that align with the desired user action.
- Test different CTAs to encourage conversions and reduce the cost per action.
- Tailor creatives for specific audience segments to improve relevance and response.
- Refresh your creatives regularly to prevent ad fatigue and maintain high performance.
- Highlight urgency or incentives to motivate quicker action.
9. Link clicks
Link clicks = the number of taps on your ad that lead users to a destination you define (e.g., your website, app, lead form or product page)
What link clicks tell you: This engagement metric tells you how many people take meaningful action (e.g., they click through from your ad to your intended destination).
Unlike “all clicks,” a metric that includes likes and shares, link clicks focus only on actions that can drive conversions, sales or leads. A high number means your ad motivates users to move beyond the scroll and engage with your brand.
This is an important metric to track if your campaign is focused on web traffic or conversions.
Example: If your ad got 500 link clicks, 500 people tapped through to your site or app.
Benchmarks: While CTR and CPC tell you how efficient your ads are, link clicks help you measure total traffic volume. To benchmark effectively, compare link clicks against expected performance based on your CTR and impressions; then layer in campaign objectives, creative format and industry norms. Remember: More clicks only matter if they drive quality outcomes, such as conversions or engagement.
What to look for:
- Low link clicks + high impressions: Your ad is ineffective. Improve your copy, visuals or CTAs.
- High link clicks but low landing page views: Check for issues on your website or app, such as slow load times, irrelevant content or poor UX.
- Rising CPC: You may need to exceed your budget to effectively reach your target audience. Narrow your targeting or refresh your creatives.
Creative tips to improve link clicks:
- Use clear, benefit-driven CTAs like “Shop now,” “Get 10% off” or “Try for free.”
- Front-load your message, as users tend to scroll quickly. Grab attention immediately.
- Test different copy and visual variations to identify the most effective versions.
- Use heatmaps and landing page analytics to identify where users drop off after they click. Optimize those pages for improved retention and conversion.
10. Engagement rate
Engagement rate = (total engagements ÷ total reach) × 100
What engagement rate tells you: This metric tells you how well your content connects and resonates with your target audience. It measures the percentage of people who interacted with your post through reactions, comments, shares, link clicks, profile taps and more.
A high engagement rate indicates that your ad is visible and prompts users to take action. This metric is especially useful at the top of the funnel to test your advertising campaign’s creative appeal.
For example, an engagement rate of 1% means 1 out of every 100 people who saw your ad engaged with it in some way. It’s an early sign of brand resonance that can boost brand awareness, recall and loyalty.
Additionally, platforms like Facebook reward higher engagement with better ad placement and reach. This factor enables you to reach a more targeted audience.
2025 benchmarks: The median engagement rate for Facebook posts is 1.06%, calculated by dividing total interactions by reach or impressions. This is lower than Instagram’s rate (a sign of how crowded the platform is).
What to look for:
- Low engagement rate + high impressions: The content may not resonate, or the target audience hasn’t been accurately identified.
- High engagement rate: Your creative lands well. This is a strong signal, even if conversions come later.
Creative tips to improve engagement rate:
- Engagement can be improved with interactive formats, such as videos and live streams, especially when your objectives are set correctly to align with your campaign goals.
- Use bold visuals and concise copy in the first few seconds.
- Test various ad formats. Note that short-form video often outperforms static images.
- Add narrative or educational elements to encourage organic interaction.
- Avoid engagement bait and focus on genuinely relevant and useful content.
- Refresh your ad creative regularly to prevent audience fatigue and maintain high interest.
- Try different CTA buttons to see which ones work best.
- Use short text. Say what you need to, fast. People scan.
Why benchmarks are important (and where to get the right ones)

It’s easy to get caught up in big numbers that look good but don’t tell the full story.
Take a campaign with a slick product teaser that garners 10,000 likes but sells zero units. It’s impressive on the surface, but those likes don’t pay the bills.
Metrics such as raw impressions, “all clicks” and 3-second video views are common traps that can inflate your confidence but hide real problems. For example, 1 million impressions with a 0.5% click-through rate means almost nobody is interested enough to click on your ad, yet the high number feels like success.
That’s why benchmarks matter. These numbers:
- Give your results context.
- Help you spot underperforming ad sets fast.
- Give you an indication of whether to optimize or scale.
- Align your metrics with real business impact.
It’s critical to track performance metrics and continuously monitor your ad results to improve performance.
Our advice is to ensure your Meta Ads reporting includes deeper engagement metrics (e.g., video completion rates, post shares and comments) and conversion indicators (e.g., purchase events, lead form submissions or newsletter signups) tied to clear ad campaign and business objectives.
Remember, your data can be divided into three tiers:
1. Indicators show broad exposure (e.g., impressions and video views).
2. Signals reveal engagement (e.g., clicks and key metrics such as click-through rates).
3. Deciders track hard outcomes like conversions, sales and ROAS.
You should aim to move from broad reach to clear, meaningful business results. However, this is only possible when your objectives are properly set and aligned with each funnel stage.
To find the right benchmarks, you can’t go wrong with the new Superads CPC Benchmark tool. It lets you compare costs by industry, country and campaign type, so you can quickly see what “good” looks like and spot where your advertising campaign needs work.
Superads’ Facebook Ads Benchmarks tool

Note that your CPC doesn’t give you the full picture and that platform-wide averages can mislead you, as costs vary a lot between industries (sometimes by as much as 3-5 times).
For instance, a $4 CPC in SaaS could signal strong performance or indicate room for improvement. It depends on your niche and goals. Without context, you just don’t know.
This is why it’s important to compare your CPC with relevant benchmarks.
CTA
Just follow three simple steps in the Superads CPC benchmark tool to get this right:
- Pick your industry.
- Select your ad campaign objective.
- See how your CPC stacks up against data from the last 30 days.
This helps you understand if you pay too much for clicks, if your bids are too low to get traction, or if your creative doesn’t resonate with your target audience.
With public CPC benchmarks, marketers should be able to make more informed assessments of how their performance could look. Typically, everyone has only focused on their own numbers, and we've all been in the dark about what our industry or niche looked like. We're attempting to change that with our tool. We're working on ways to include industry benchmark data directly within the product.

When you know exactly where you stand, you can spend smarter, boost cost efficiency and see better results from your Facebook ads.
Open the benchmark tool now. No sign-up required.
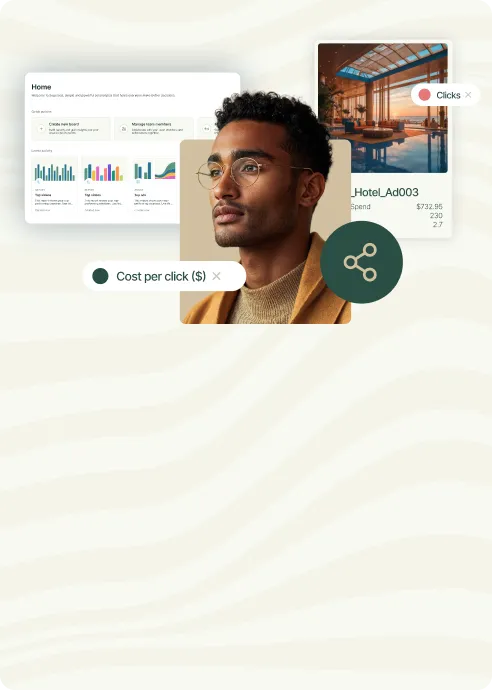
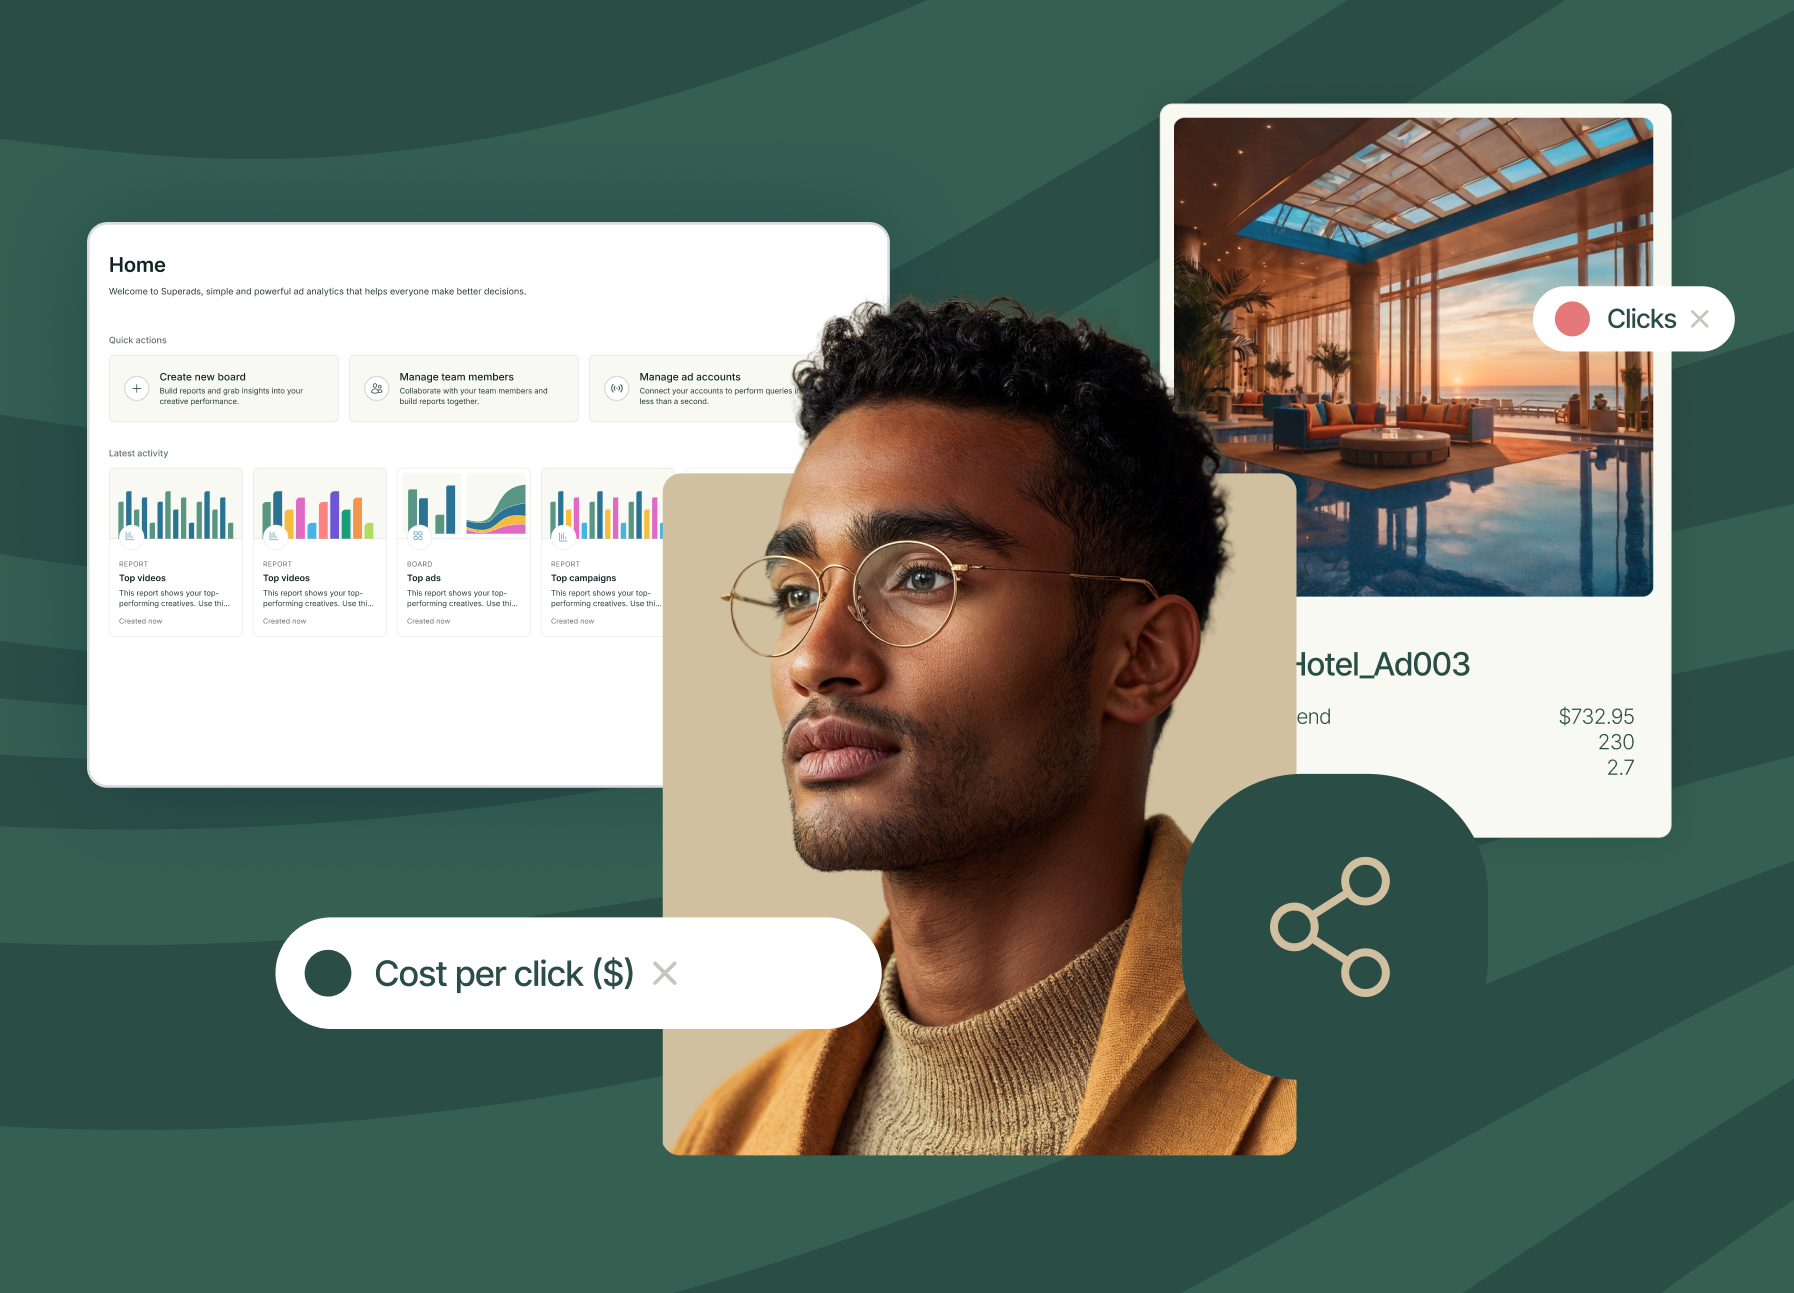
Superads turns campaign metrics into a creative feedback loop

Facebook Ads Manager gives you numbers. Superads shows you why those numbers matter.
Our AI-powered tool transforms raw Facebook ads data into clear, visual creative performance insights. Whether you manage one brand’s ad campaigns or juggle multiple accounts, Superads makes it easy to track key Facebook ads metrics and instantly see what works.
With Superads, you can:
- Continuously monitor and track performance across multiple Facebook ad accounts in one place. This capability makes the tool perfect for agencies or teams that manage several brands.
- Break down results by creative elements like hooks, CTAs, tone and format. Say goodbye to strict naming conventions.
- Build live dashboards that visually highlight your top-performing ads to help your team stay aligned and move faster.
Facebook ad metrics are only useful when they drive decisions
This deep dive into the 10 key Facebook metrics that truly matter is just the start. It’s essential to use these insights to shape your creative strategy over time.
While Meta Ads Manager gives you the raw numbers, it doesn’t tell you the full story. Superads fills the gap and helps you to turn your Facebook ads performance data into clear creative insights that boost results.
Get the full story behind your Facebook ad performance. Sign up for Superads today to track Facebook ads metrics across ad campaigns and spend your creative budget better.

Improve your clients' ROI
Track multiple accounts in just one place.
Tailored for your agency's needs. Optimize with AI.

Improve your ad campaigns
With the only AI-powered creative insights tool
built for modern marketers.
Facebook Benchmarks
Check out fresh CPC, CPM, CTR
Facebook Ads data.
Filter by industry, country or
campaign type.
Improve your ad campaigns
With the only AI-powered creative insights tool
built for modern marketers.