Ever stared at your Facebook Ads dashboard wondering if your $2.75 CPC is brilliant or bleeding money? You're not alone.
That's why we built the industry's first comprehensive, public Facebook Ads benchmarking tool at Superads.
It's free, it's live and it's based on real data, not some marketer's best guess from 2017.
You try it today:
Facebook Benchmarks
Check out fresh CPC, CPM, CTR
Facebook Ads data.
Filter by industry, country or
campaign type.
It's based on over $2B in anonymized ad spend from thousands of accounts using Superads. All data is fully aggregated and anonymized. No individual account is ever identifiable.
Think of it sort of like Google Analytics’ Benchmarking reports or Stripe’s industry benchmarks. But for paid social.
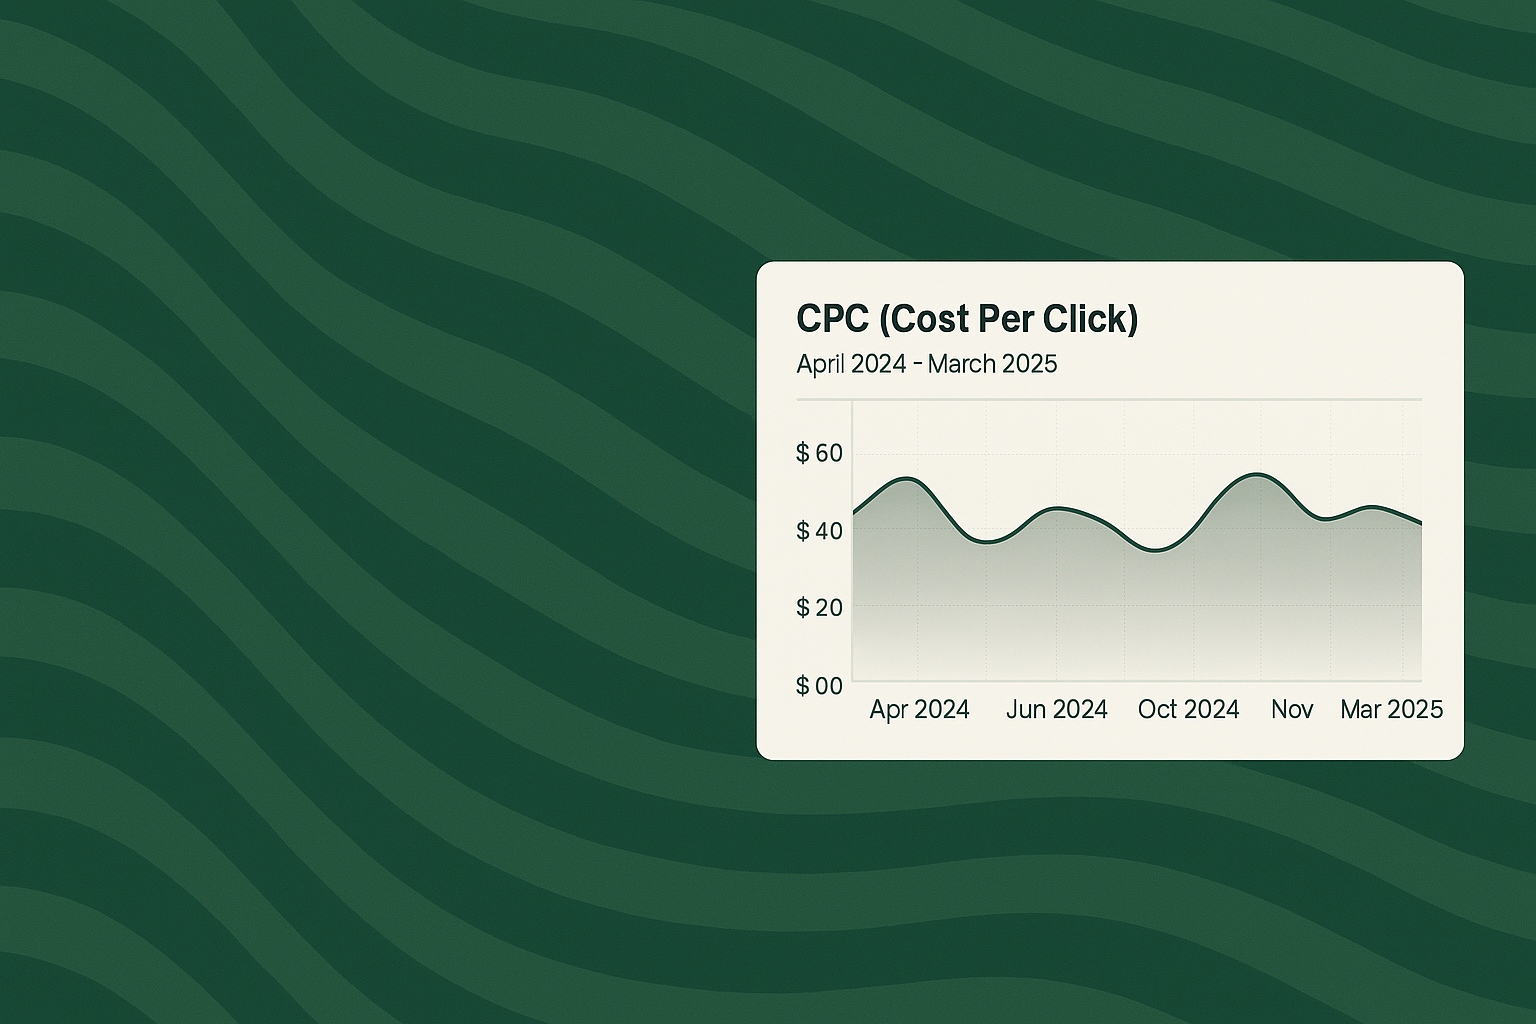
You can currently select CPC (cost-per-click), CPM (cost per thousand impressions), or CTR (click-through rate). And slice the data by industry, campaign type and country.
Is your CPM spike an industry-wide trend?
Is your CTR truly exceptional or just average for your vertical?
These are questions you can now answer with data, not gut feelings.
What's next
This is just the beginning.
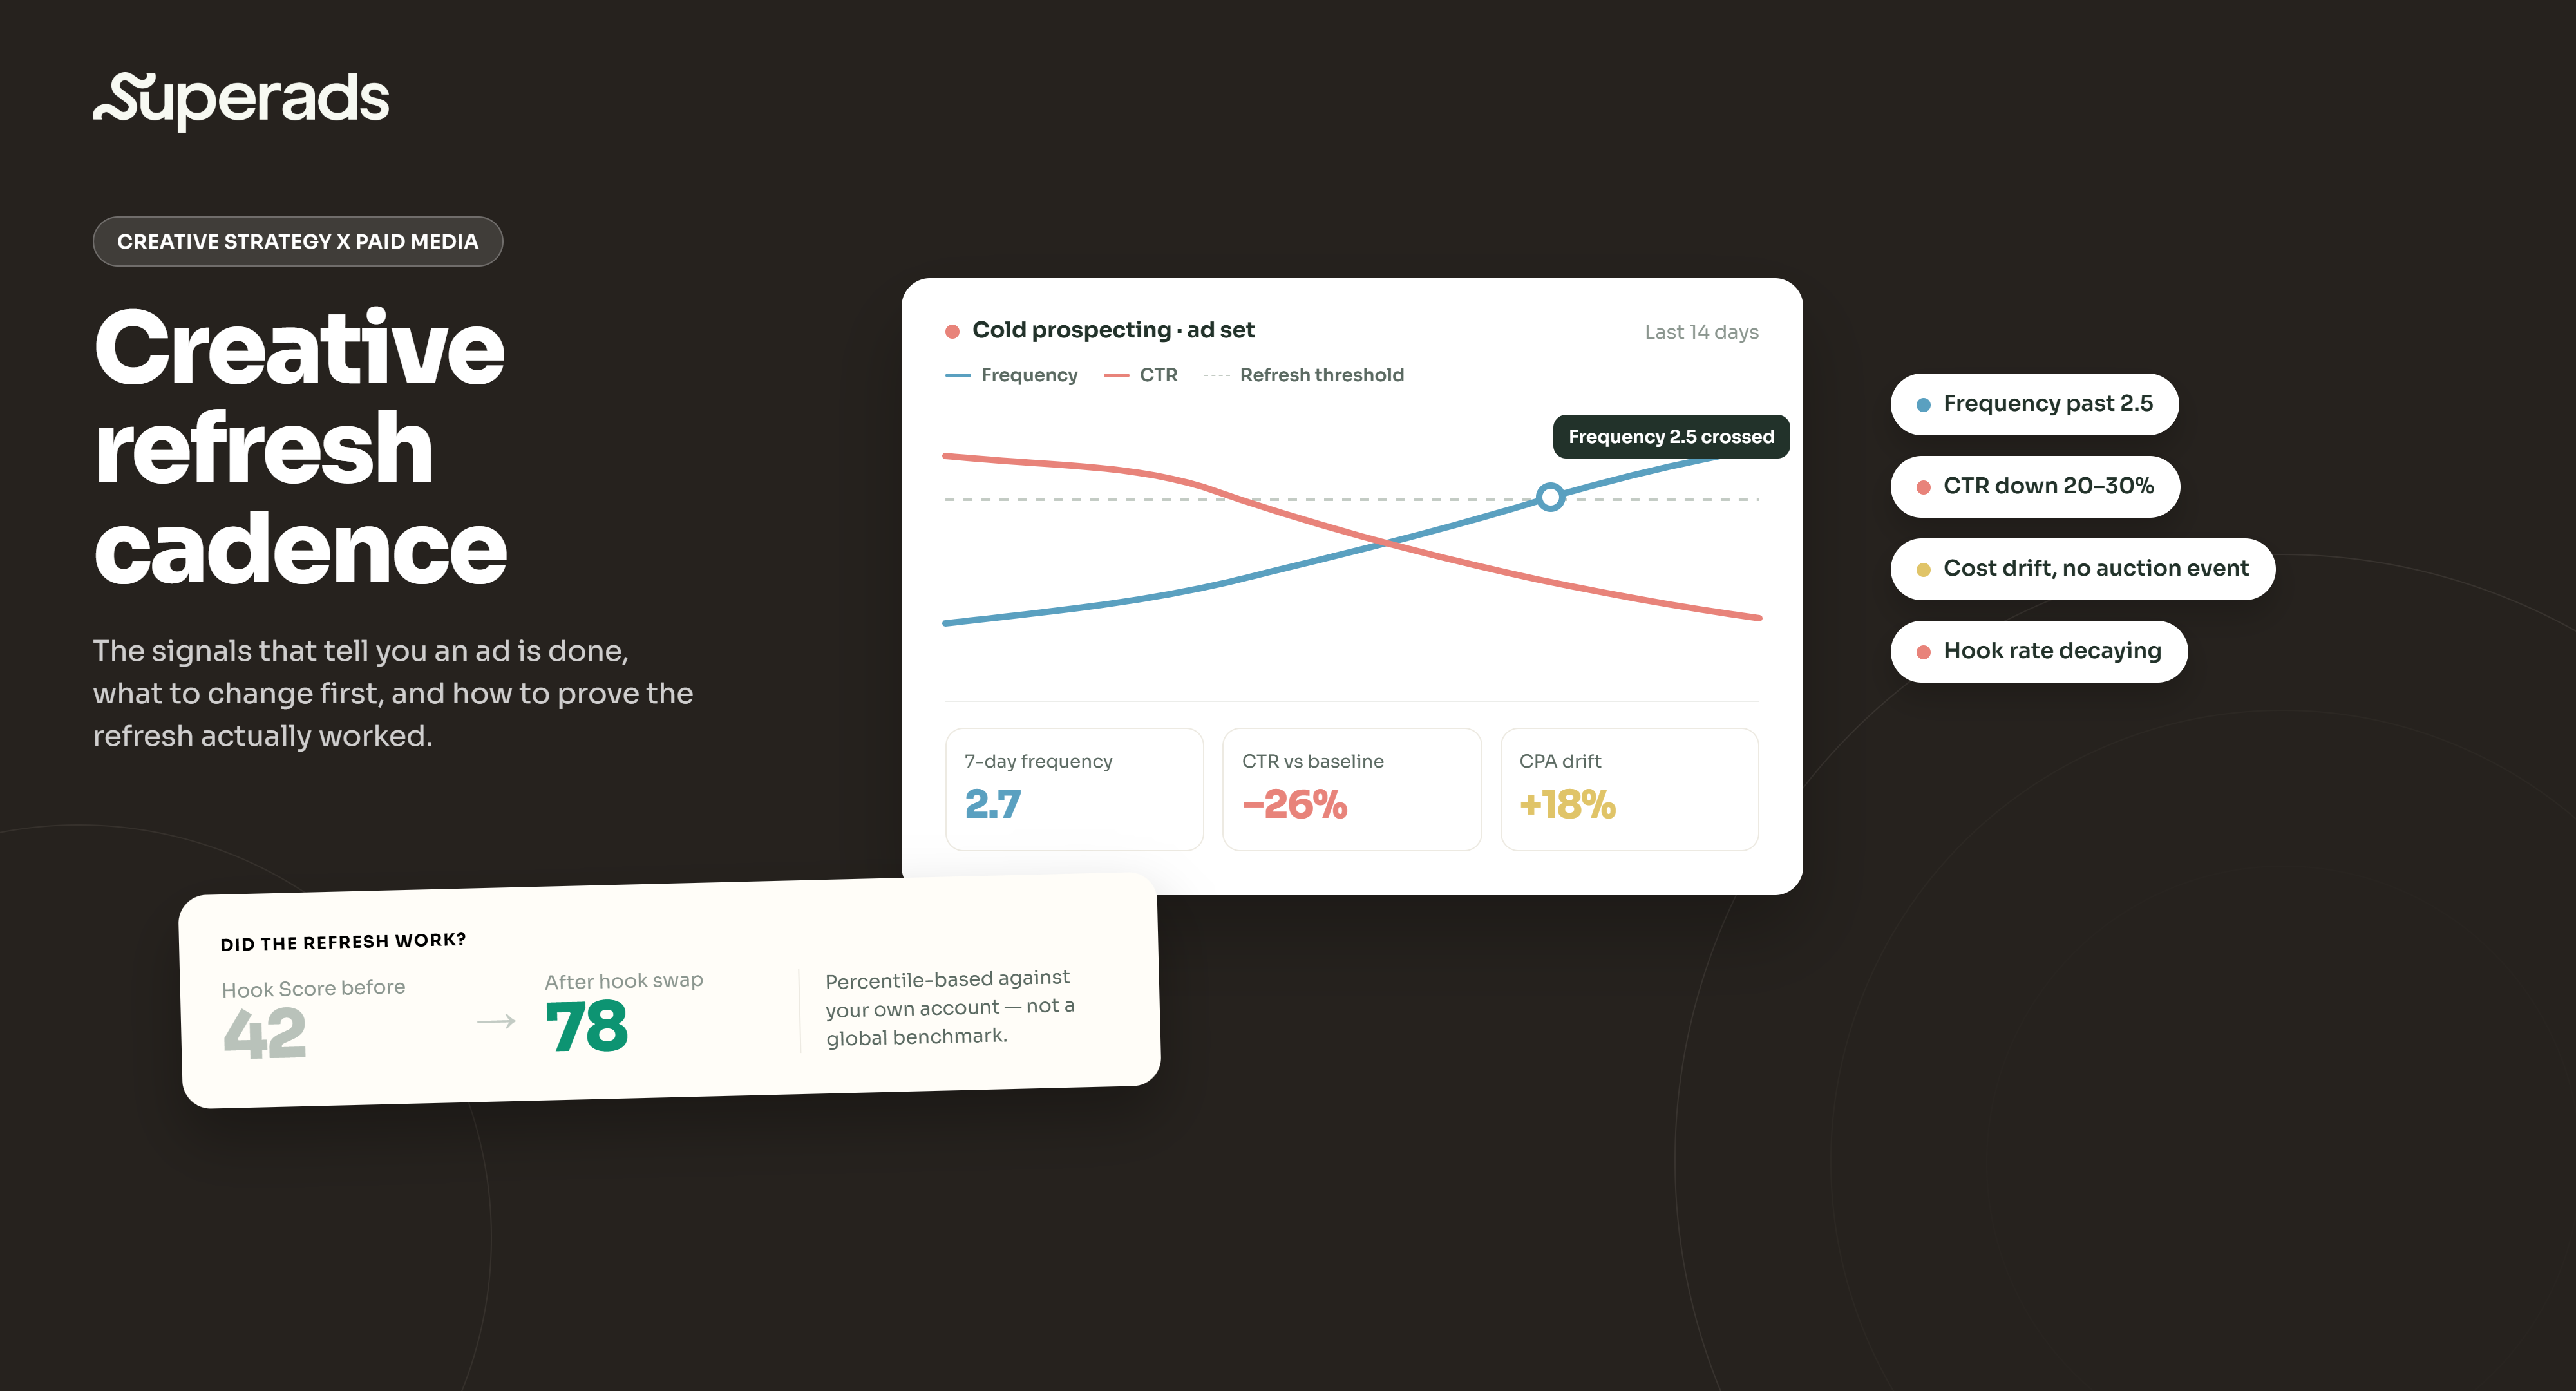
Later this week we're rolling out Superads Scores inside our platform: internal benchmarks that compare each of your ads against your own historical performance. You'll see exactly how each creative stacks up on CTR, hook rate, conversion rate and engagement metrics.
And the next move will be adding industry benchmarks directly in Superads.
Let us know what other metrics or breakdowns would help your team make better decisions.

Improve your ad campaigns
With the only AI-powered creative insights tool
built for modern marketers.