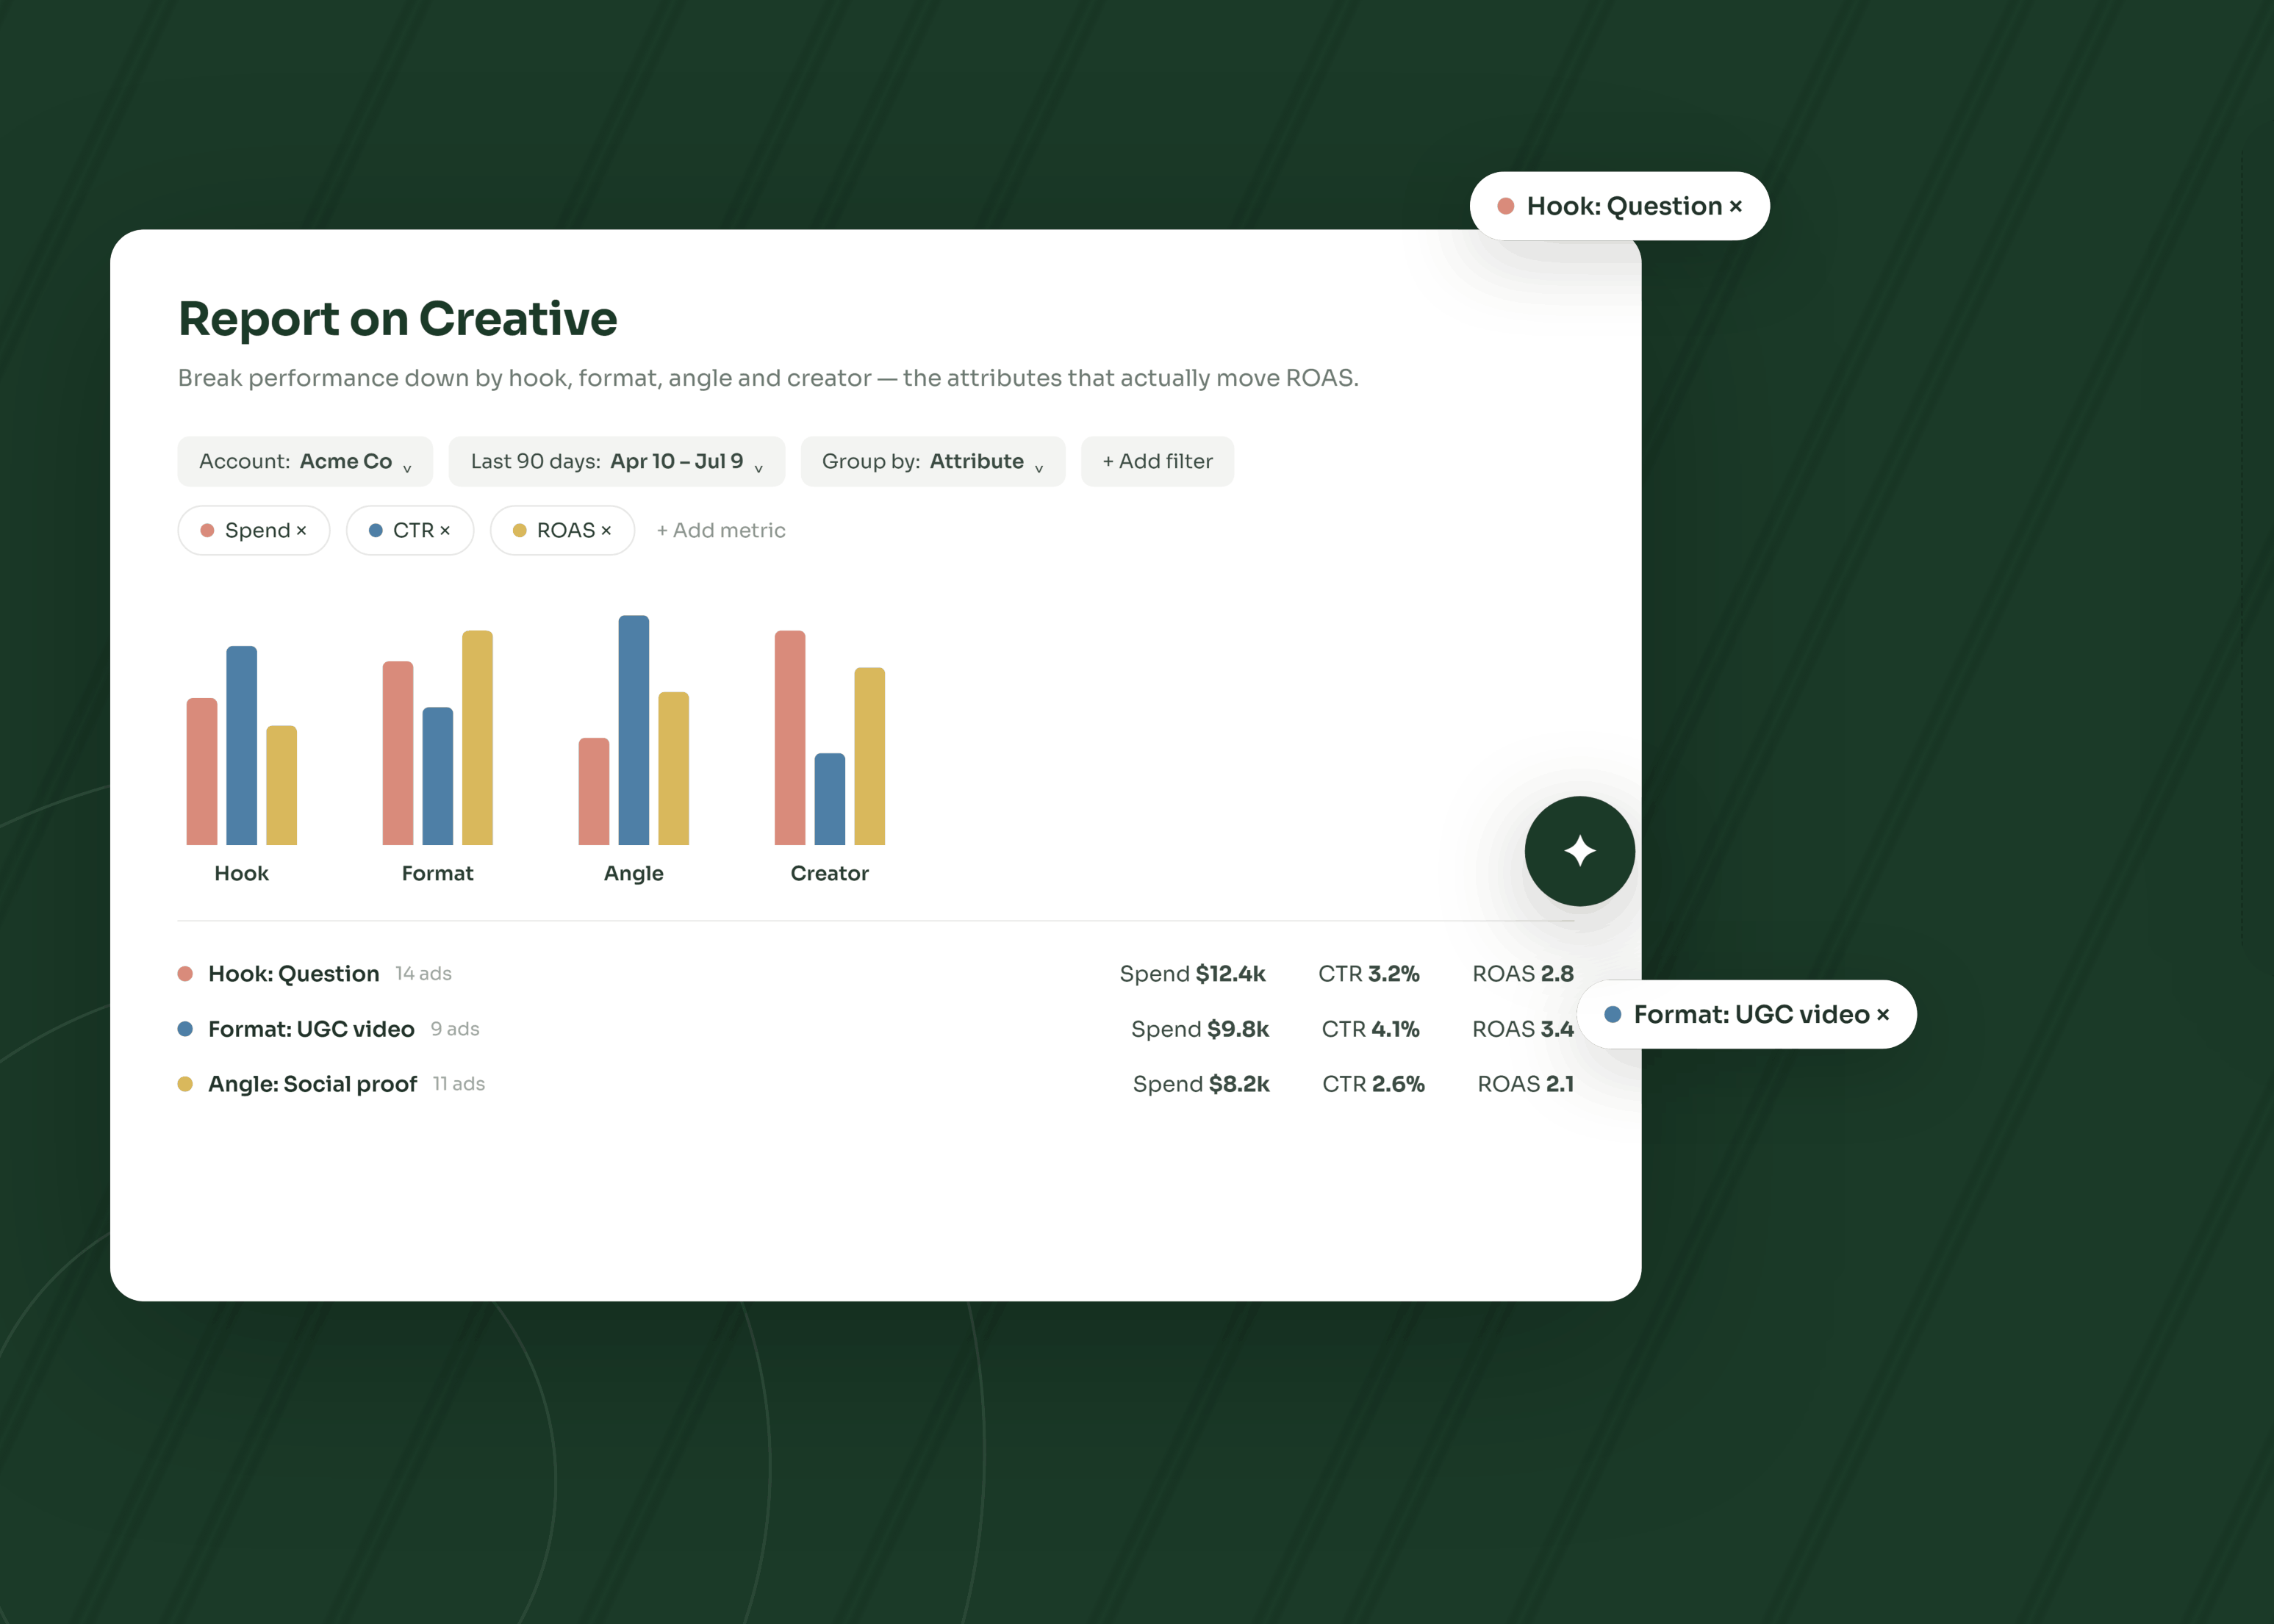
Creative is the single biggest lever in paid advertising, but most teams still report on it the same way they report on media: campaign-level CPMs, CTRs and ROAS pulled from siloed dashboards. To analyze creative performance properly, you need to look at ads at the asset level, group them by attributes that matter (hook, format, angle, creator), and tie those attributes back to business outcomes. This guide walks through the metrics that matter, a six-step framework for building a creative performance report, and how AI-powered tools like Superads compress the whole process from days to minutes.
Creative performance is a measure of how effectively a specific ad asset drives a desired outcome, judged against the creative variables you can control: the hook, the format, the messaging angle, the visual style, the creator, the offer and so on.
It's distinct from campaign performance and media performance. A campaign-level ROAS tells you whether a budget is working. A creative performance read tells you why.
It answers questions like:
- Which hook style is keeping people watching past the three-second mark?
- Are testimonial videos outperforming founder-led videos this quarter?
- Is our top-spending ad actually our top-converting ad, or just the one we've fed the most budget?
- Which creator is delivering the lowest CPA across our last 30 days of UGC?
This is the kind of signal that lets a creative team know what to make next. And it's what most native ad platforms are not built to surface clearly. For a deeper definition, we have written a full primer on what creative analytics is and why it matters.
Why creative performance reporting matters more than ever
Three forces have made creative the most important variable in paid advertising performance.
- The data backs it up. IPSOS reports that creative drives roughly 75% of a campaign's success. Meta's own research with Nepa shows that following creative best practices can drive a 1.2–2.7x increase in long-term sales.
- Targeting is no longer where you compete. With privacy changes, Apple’s IDFA (Identifier for Advertisers) changes, and the rise of broad targeting on platforms like Meta (driven by updates such as Andromeda), the algorithm is doing more of the audience work for you. What you put in front of people now does more of the heavy lifting than who you serve it to.
- Output volume keeps climbing. Most performance teams now produce dozens of new ad variants per week across Meta, TikTok, LinkedIn, and Google. Without a consistent way to evaluate them, the decision of "what to make next" becomes a guessing game.

"In a crowded market, the way to differentiate your brand is through impactful creatives, and being able to measure their effectiveness is critical."

The teams pulling ahead in today are the ones treating creative as a measurable asset class, not a feeling.
The metrics that signal real creative performance
A solid creative performance report goes beyond standard media metrics. You need a layered view: what's grabbing attention, what's holding it, and what's converting. Here's how the categories break down.
Attention metrics (top of the funnel)
These tell you whether your ad earns the first few seconds of someone's time.
- Hook rate. Calculated as 3-second video views divided by impressions. Higher is better. Your first three seconds are doing the work.
- Thumb-stop rate. A stricter version, sometimes measured as 2-second views over impressions, depending on platform.
- Hold rate. Average percent of video watched, or the ratio of completions to 3-second views. This tells you whether the ad keeps the attention it captured.
Engagement metrics (middle of the funnel)
These show whether the creative provokes a response.
- CTR (click-through rate). The workhorse metric, but read it alongside CPM to avoid being fooled by cheap impressions.
- Reactions, comments, shares. Useful for brand campaigns and a signal of resonance, even when the conversion goal is downstream.
- Saves and follows. Increasingly relevant on TikTok and Instagram, often correlated with creator quality.
Outcome metrics (bottom of the funnel)
These connect creative back to the business.
- CTR-to-conversion ratio. A high CTR with low conversion usually means the ad is interesting, but the offer is off.
- CPA / CPL. The actual cost of the result you care about.
- ROAS / Purchase ROAS. For e-commerce. For B2B and lead gen, look at cost-per-MQL or cost-per-demo.
- Frequency. Climbing frequency on a flat-to-declining ROAS curve is the textbook signal of creative fatigue. It has been noted by users that, in Meta specifically, post-Andromeda fatigue tends to show up faster.
A common mistake is to read these in isolation. It won’t matter to have a strong hook rate, but a weak hold rate (since it’s just a cold opener with no follow-through). Or, a creative with a great CTR but a terrible CPA is buying you traffic, and not customers.
The job of a creative performance report is to read all three layers in one place.
How to analyze and report on creative performance: a 6-step framework
This is the framework most paid media teams converge on, regardless of whether they're running a $50K/month account or a $5M one.
The steps stay the same, while the tools and cadence scale.
Step 1: Define the question the report needs to answer
A report without a question is a dashboard. A report with a question is a decision-making tool.
Common questions to anchor a creative performance report:
- Which of our active creatives are working, and which should we kill?
- What's our best-performing hook, format, and angle this period vs. last period?
- Which creator (or production partner) is producing our highest-ROAS ads?
- Where are we showing creative fatigue, and on which platform first?
- What concepts should we test next, based on what's already winning?
Pick one. Ten different questions mostly need ten different reports.
Step 2: Set the right scope and time window
Creative performance is sensitive to scope. A 7-day window will rarely give you statistical confidence on anything but your highest-spend ads. A 90-day window can dilute recent learnings.
A practical rule of thumb:
- Always-on evergreens: look at rolling 30 or 60 days.
- New creative tests: wait until each variant has cleared a meaningful spend threshold (e.g., $500–$2,000 per asset, but it will depend on your CPA target) before declaring a winner.
- Trend reads: compare the current 30-day window against the previous 30 days, with creative attributes overlaid.
Your scope decision is also a creative-fairness decision. Make sure the two ads being compared had a roughly equal shot: similar audiences, similar placements, similar budget exposure.
Step 3: Tag your creatives with the attributes that matter
This is where most reports fall apart. If your only label for an ad is its ID, you can't analyze the creative; you can only analyze each individual asset. Aggregation only works when you have shared attributes.
The tagging dimensions worth capturing:
- Hook type: question, statistic, demo, problem-agitate, before/after, etc.
- Format: UGC, founder-led, talking head, animation, static, carousel, product-only.
- Messaging angle: pain point, aspirational, social proof, comparison, urgency.
- Creator: which talent or partner produced it.
- Offer: discount, free trial, guarantee.
- Visual style: minimalist, lifestyle, studio, screen-record.
There are three ways teams do this:
- Naming conventions. A structured ad-name format lets you slice the data later. It works, but it requires discipline and breaks the moment someone forgets the format.
- Manual tagging in a spreadsheet. Reliable, but a time sink. Most teams abandon it inside a quarter.
- AI tagging. Modern creative analytics tools analyze the actual content of the ad (visuals, copy and on-screen text), and assign tags automatically. This is the better approach that helps you scale when you're shipping dozens of new variants a month.
Most reporting tools focus on general marketing metrics. Creative analytics is a different category. It's about measuring creative effectiveness, not just media efficiency.

Step 4: Group, compare, and look for patterns
Once your ads are tagged, the analysis becomes a series of comparisons.
- Group by hook type: Which hooks are driving the lowest CPA?
- Group by format: Does UGC beat polished studio video on TikTok? Does it on LinkedIn?
- Group by angle: Is the comparison angle outperforming the social-proof angle this month?
- Cross-group: Does the founder-led + pain-point combination beat UGC + aspirational across both Meta and TikTok?
This is where the real insights live. The single best-performing ad isn't always the most useful data point — repeatable patterns are. If three of your top five ads share a hook style, that hook is your next brief, not just a lucky asset.
If you're running cross-platform, never stop at platform totals. The same hook can dominate on Meta and flop on TikTok. Comparing creative performance across Meta and TikTok in one view is one of the highest-leverage analyses in paid social.
Step 5: Translate findings into creative briefs and budget moves
A creative performance report is only valuable if it changes what happens next. Your output from Step 4 should be turning into two artifacts:
- A test queue for the creative team. "Brief three new variants of our top-performing pain-point hook with different creators." Or, "Kill the four lowest-performing UGC ads and free up $4K of weekly spend."
- A budget reallocation note for the media buyer. Analyze and select which creative gets more spend, which gets less and which gets retired.
Without this step, reporting becomes a ritual instead of a decision input.
Step 6: Share it in a format your stakeholders will check
Creative performance reports tend to die in two ways: they're either a dense spreadsheet that only the analyst understands, or a static slide deck that's already out of date by the time it lands in someone's inbox.
What works:
- Visual reports with creative thumbnails alongside metrics, so the creative team can see the ad while reading the data.
- Live, interactive links that the recipient can sort and filter, instead of frozen exports.
- A standing cadence weekly for active accounts, monthly for executive readouts.
How Superads helps you run creative performance reports
Building the framework above manually takes hours per report. Superads compresses it to minutes, and is built specifically around the creative-level questions paid media teams ask.
Here's where it fits each step of the framework above:
- Tagging without spreadsheets. Superads' AI tagging analyzes the visual and textual content of each ad and applies labels for hook type, format, visual style, content creator, language, and custom criteria, without requiring naming conventions.
The same is true for grouping: the AI Assistant scans your existing ad names and suggests custom breakdown groups in one click.
- Cross-platform comparison in one report. Superads is the only creative analytics reporting tool that includes both LinkedIn and Google Ads alongside Meta and TikTok in a single report.
Most competitors limit you to one platform per report or skip Google Ads entirely.
- Superads Scores for shared language. Every ad gets a 0–100 score across five creative dimensions: Hook Score, Hold Score, Click Score, Engagement Score and Conversion Score. Each score is calculated as a percentile against your own historical ads (not a generic global benchmark), so a green score means "this ad outperforms your own median," which is the comparison that matters. Available on Meta, TikTok and LinkedIn.
- Conversational AI grounded in your data. Superads AI (Ask AI) lets you ask questions like "Which hooks are driving the best CPA this month vs. last month?" or "Which creatives are starting to fatigue?" and get answers based on your actual ad performance.
It reasons over live numbers across all your connected accounts.
- Visual-first reports designed for creative teams. The default Gallery view shows ad thumbnails next to metrics and Scores, so designers and strategists can see the ad alongside the data. No more squinting at ad IDs in spreadsheets.
- Live, interactive sharing. Reports and Boards are shared as live links that recipients can sort, filter, and explore in real time. Not PDFs. Not screenshots. Clients and stakeholders see the same data the team does, and the data is never stale.
"Superads gave us clarity we've never had before. Instead of guessing which ads were responsible for our best ROAS, we could see exactly which creative concepts, visuals, and copy were actually driving performance." — G2 verified reviewer.
10,000+ teams use Superads for this workflow today. The free plan covers one report and is enough to run the framework above on a single ad account. The Pro plan starts at $49/month and unlocks multi-platform reports, AI tagging, Superads AI and unlimited reports.
Want to see your creative performance unified across platforms in under five minutes? Get started with Superads for free.
FAQs
Facebook Benchmarks
Check out fresh CPC, CPM, CTR
Facebook Ads data.
Filter by industry, country or
campaign type.

Improve your ad campaigns
With the only AI-powered creative insights tool
built for modern marketers.